

Global SVOD subscription growth more than halves by 2031. Streaming revenue keeps climbing anyway. Here’s where the new money comes from.
SVOD subscriptions are growing 6.2% this year. By 2031, that falls to 2.7%.
But the market doesn’t shrink. Total streaming revenue rises from $274B to $358B over the same period. That’s $84B of new money in five years.
For a decade, streaming was a subscriber story. Add users, win the market. That playbook is running out of road. What matters now is what each subscriber pays, how many services they hold, and how much of the bill advertisers pick up.
Streaming is also pulling further ahead of Pay TV. SVOD subscriptions will reach 2.7B by 2031, double Pay TV’s 1.3B.
Our Video Markets Tracker covers 70+ countries and forecasts platform-level KPIs to 2031. Three findings stand out:
- Revenue outgrows subscriptions in every region.
- Stacking is propping up growth in mature markets, but it has a ceiling.
- Advertising will deliver almost half of all new streaming revenue.
Revenue beats subscriptions in every region
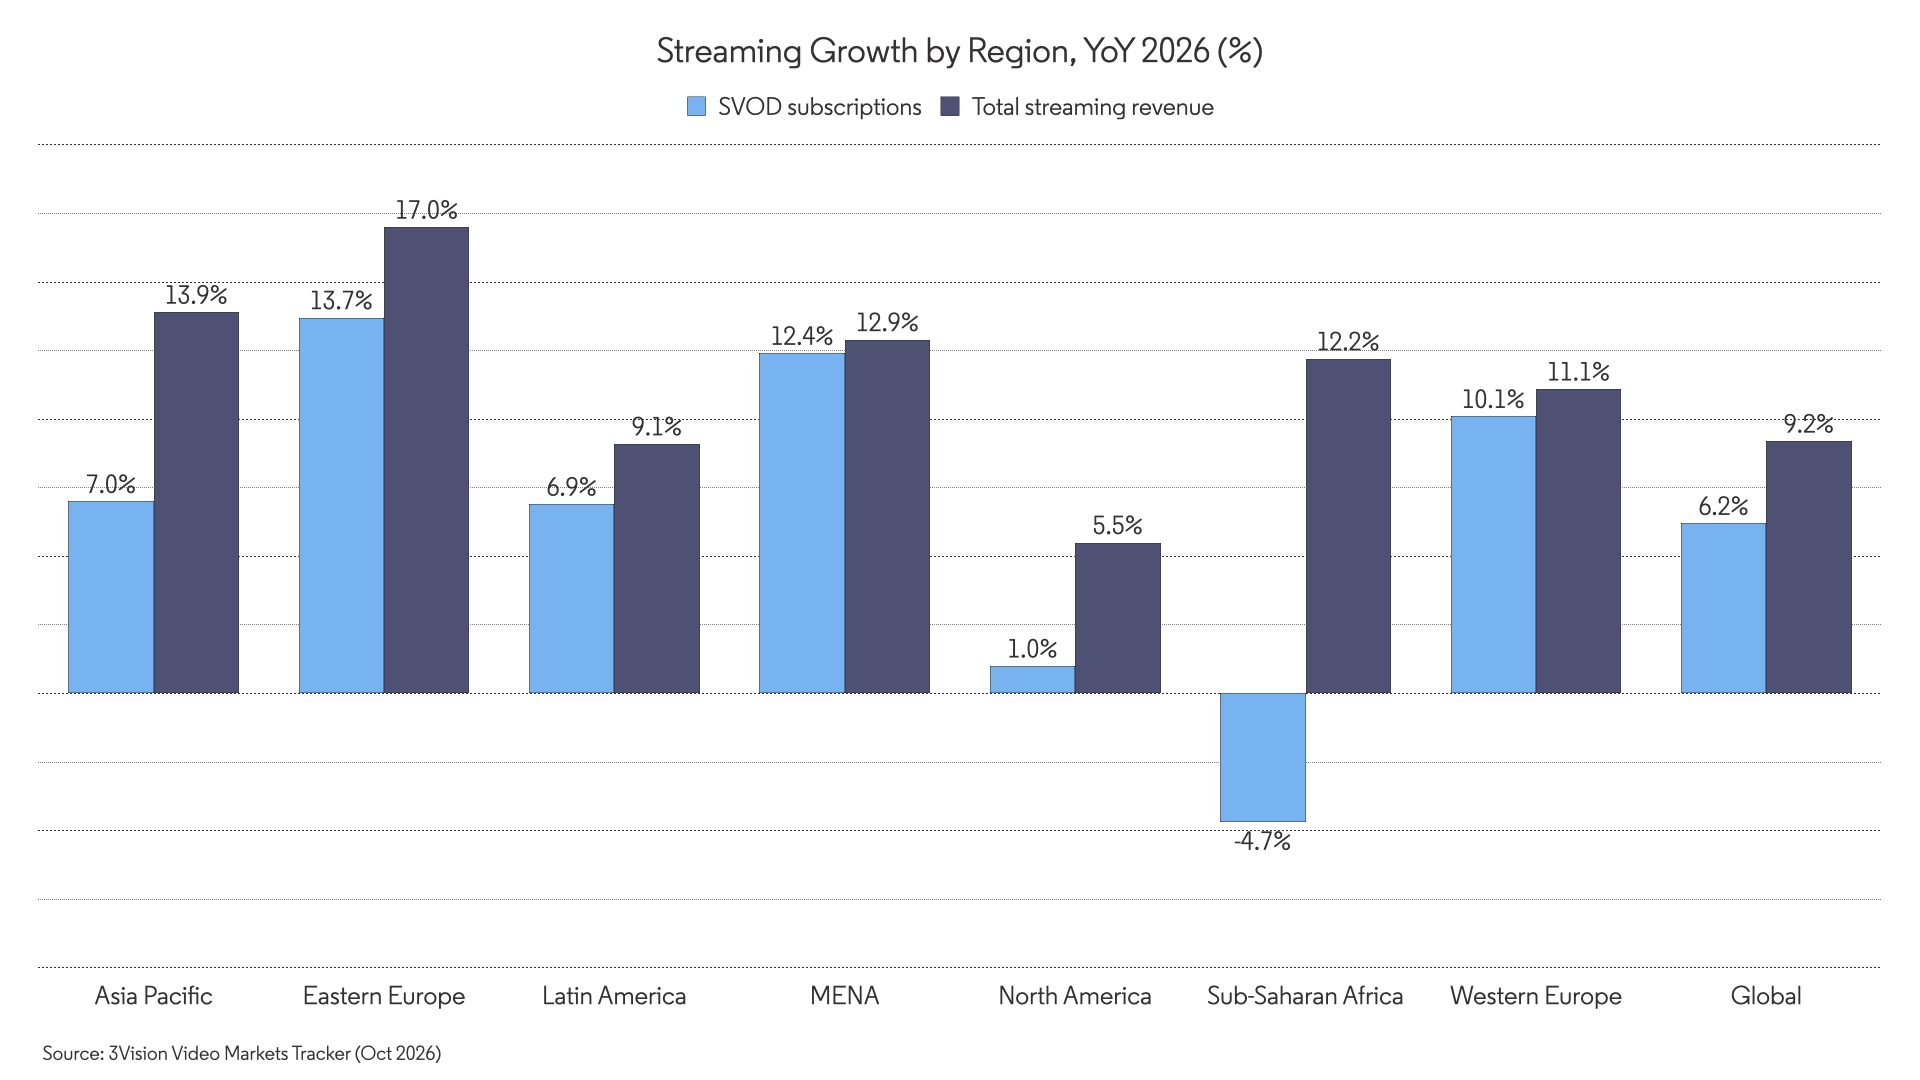
This year, global streaming revenue grows 9.2%. SVOD subscriptions grow 6.2%. That’s three points of daylight.
The gap shows up in every region we track, but it isn’t the same size everywhere. The differences tell the story.
Asia Pacific has the widest gap. Revenue grows 13.9% on subscription growth of 7.0%. Revenue is growing at twice the pace of users.
North America is the starkest. Subscriptions grow just 1.0%, yet revenue still grows 5.5%. A market that has almost stopped adding users is still adding billions.
Sub-Saharan Africa is the most extreme. SVOD subscriptions fall 4.7% as Showmax’s closure removes a platform from the market. Total streaming revenue still grows 12.2%.
MENA and Western Europe are the exceptions that prove the rule. The gaps are small: 12.4% subscriptions against 12.9% revenue in MENA, and 10.1% against 11.1% in Western Europe. Growth in both is still mostly about new subscriptions.
Eastern Europe is the fastest of all, with 13.7% subscription growth and 17.0% revenue growth. It also has the most room left to run.
The pattern is clear. The more mature a market gets, the more revenue growth detaches from subscription growth. Where subscriptions stall, platforms have to find money elsewhere. And they do.
Price is the 2026 story. Advertising is the five-year story.
So what fills the gap? Price and advertising. But they don’t carry equal weight.
Start with price. SVOD revenue grows 8.3% this year against 6.2% for subscriptions. Roughly two points of that gap come from price and mix. 2026 is a pricing year.
It won’t last. From 2027, the gap narrows to well under a point a year. SVOD revenue grows 5.5% in 2027 on 5.0% subscription growth. By 2031 it’s 3.4% on 2.7%. Price still helps, but it’s no longer the main event.
Advertising is. AVOD revenue, including FAST, grows 11.1% this year and is still growing 6.3% in 2031. From 2027, it grows at nearly twice the rate of SVOD revenue, every year, through to the end of the forecast.
Nothing is immune from slowing. AVOD audience growth drops from 5.3% to 3.4%. Total streaming revenue growth falls from 9.2% to around 4.4% by 2031. But advertising slows from a much higher base, and for longer.
Stacking keeps the numbers moving
A subscription is a contract. A subscriber is a person. And one person can hold several.
In 2026, 0.99B people hold 2.26B SVOD subscriptions. That’s 2.3 services each. By 2031, it’s 2.70B subscriptions and 1.15B people.
Gross subscriptions grow 3.6% a year. Net subscribers grow 3.1%. That half-point gap is stacking: existing subscribers adding another service instead of new people joining. Globally, it’s a modest effect. Market by market, it varies hugely.
North American subscribers hold 4.6 services each, twice the global average. And that barely moves, from 4.55 in 2026 to 4.60 in 2031. North America has stopped stacking.
Western Europe and MENA are just starting. Services per subscriber rise from 2.46 to 2.82 in Western Europe and from 1.88 to 2.23 in MENA. Those are the steepest climbs of any region. Asia Pacific barely moves, from 1.86 to 1.90. Sub-Saharan Africa climbs from 1.62 to 1.76 off a tiny base.
Consolidation shows why this matters. Skydance combines Paramount+ and HBO Max, a paper total of 219M subscriptions that counts contracts, not people. Assuming 25% US overlap, at least 12.5% of US subscriptions disappear in 2027, from 106M to 92.8M. As prices rise, we expect the combined service to fall below 90M by 2031, with under 80M possible, even as revenue holds. Disney (including Hulu), Netflix, ViX and Peacock gain most, with ViX growing fastest in percentage terms.
North America: saturated, and still monetising
North America is the clearest test of what happens when subscriber growth runs out.
The region has 0.86 SVOD subscribers per TV household, flat to 2031. Total SVOD subscriptions rise from 546M to 567M over five years, about 4% in total.
Revenue tells a different story. SVOD revenue grows from $74.8B to $84.1B, a steady 2.4% a year. The US spends $569 a year per TV household on SVOD, 1.7 times the next highest market, Austria. By 2031, that reaches $630.
The mix is shifting underneath. Netflix is flat at $19-20B in North America across the forecast. YouTube TV grows from $12B to $18B and takes second place. Netflix isn’t where North American growth comes from.
The biggest shift is advertising. North American AVOD revenue grows from $38.2B to $50.3B, an increase of $12.1B. SVOD adds $9.3B. In the world’s largest streaming market, ads now bring in more new money than subscriptions.
Asia Pacific: the headroom, and the price of it
If North America is full, Asia Pacific is where the volume is.
The region holds 1.08B of the world’s 2.26B SVOD subscriptions, almost half. By 2031, it contributes 235M of the 441M new subscriptions added globally. That’s more than half of all growth.
Penetration explains why. Asia Pacific has 0.59 SVOD subscribers per TV household, rising to 0.68. Eastern Europe has 0.42, rising to 0.54. Both have clear headroom. North America has none.
But volume isn’t value. Asia Pacific has twice as many SVOD subscriptions as North America and about half the SVOD revenue: $38.3B against $74.8B. Platforms show the same pattern. Jio Hotstar has more SVOD subscriptions than Netflix, 362M against 329M, but earns about a twelfth of the revenue.
So the question in Asia Pacific isn’t how to find more users. It’s how to turn the users you have into revenue.
Western Europe is where volume and value are both growing. SVOD revenue rises from $31.4B to $43.4B, a 6.7% annual rate and almost three times as fast as North America. Eastern Europe grows faster again, from $4.9B to $7.7B.
Advertising takes almost half of all new money
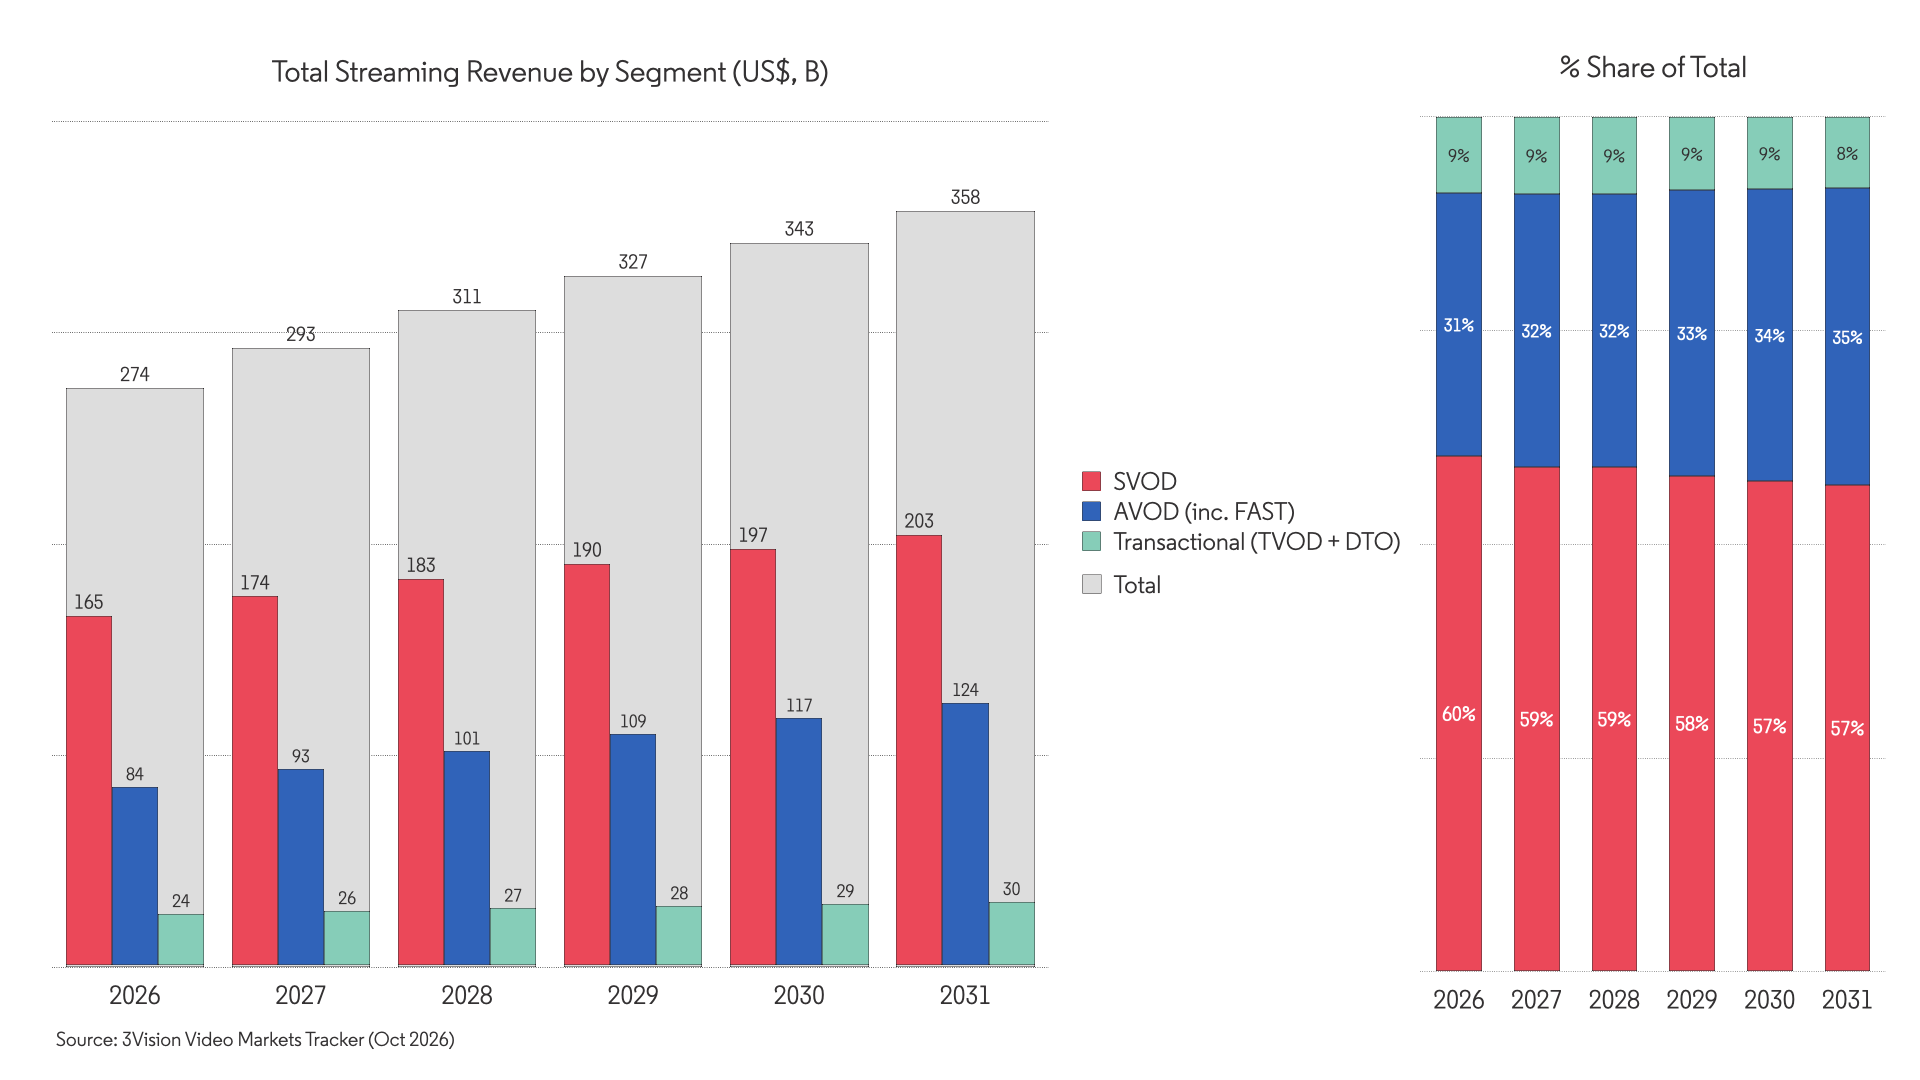
Total streaming revenue grows by $84B between 2026 and 2031. SVOD adds $38B. AVOD, including FAST, adds $40B. Transactional adds $6B.
That makes AVOD the single largest source of new streaming revenue. SVOD still dominates the total, but its share slips from 60% to 57%. AVOD climbs from 31% to 35%. Transactional slides to 8%.
The regional picture varies, and so does the reason.
MENA is already the most advertising-led region. AVOD is 44% of streaming revenue in 2026 and 45% by 2031. Ads aren’t a growth story there. They’re the established model.
Latin America shows the biggest shift. AVOD rises from 27% to 36% of revenue. SVOD revenue grows just 2.2% a year and local platforms shrink, so advertising picks up the slack.
Sub-Saharan Africa climbs from 35% to 41%, the second biggest gain in the world.
Eastern Europe stays lowest, at 24% rising to 26%. Subscription growth there still has plenty of room to run.
The audience is in Asia. The money is in North America.
Advertising has the same geography problem as subscriptions.
AVOD audiences grow from 6.2B monthly active users in 2026 to 7.55B in 2031, about 4% a year. Two thirds of them are in Asia Pacific by 2031.
But the revenue sits elsewhere. This year, Asia Pacific accounts for roughly two thirds of the AVOD audience and just under a quarter of AVOD revenue. North America has under a tenth of the audience and 45% of the revenue.
The platform map is just as concentrated. YouTube earns 51% of all AVOD revenue this year, $43.4B. In 2031, it still earns 49%, at $60.7B. Its audience share slips from 38% to 34% as Chinese platforms gain, but its revenue share barely moves. Reach isn’t the same as monetisation, and YouTube monetises better than anyone.
Below YouTube, the field is thin. Pluto TV, The Roku Channel and Tubi each earn only $1-2B. FAST audiences are growing fast, though. Samsung TV Plus adds 44M users to reach 156M. Tubi adds 22M. LG Channels adds 18M. The test for FAST is whether that reach turns into revenue.
What this means for you
Three conclusions follow.
Subscriber count is no longer the metric that matters. Jio Hotstar out-subscribes Netflix and earns a fraction of the revenue. Amazon has more North American subscriptions than Netflix and a fifth of the revenue. Revenue per subscriber, revenue per user and revenue mix are now the numbers that separate winners from the rest.
Advertising is no longer an add-on. In every region we track, it takes a bigger share of streaming revenue by 2031 than it does today. In North America, it already adds more new money than subscriptions. If you don’t have a credible ad proposition, you’re leaving the biggest growth line in the market to your rivals.
Regional playbooks are splitting. North America is a monetisation market. Asia Pacific and Eastern Europe are volume markets that have yet to prove they can convert. Western Europe is growing on both counts. Latin America and Sub-Saharan Africa are being pushed towards advertising. A single global strategy won’t fit any of them.
It’s also the logic behind the consolidation we’re seeing in Hollywood, Europe and Africa. When subscriber growth slows and subscribers stack, scale and combined catalogues matter more than another launch. The buyer list is shrinking because the maths now favours fewer, bigger players.
What to watch
Three things will decide whether this forecast holds.
First, whether North American stacking has really peaked at 4.6 services. If it keeps climbing, the region’s growth looks better than we show. If subscribers start to cut back, it looks worse.
Second, whether Asia Pacific platforms can lift revenue per subscription without losing the price-sensitive users who built the base.
Third, whether advertising can sustain 6-10% annual growth as audiences slow. It has to, because nothing else in streaming is growing faster.
The next five years aren’t about streaming running out of growth. They’re about growth changing shape. The sooner you read that shape, the better your next move.
Our Video Markets Tracker provides platform-level forecasts across 70+ countries to 2031, covering SVOD, AVOD, FAST and transactional. To see the data behind this story, book a demo.